Term Definitions
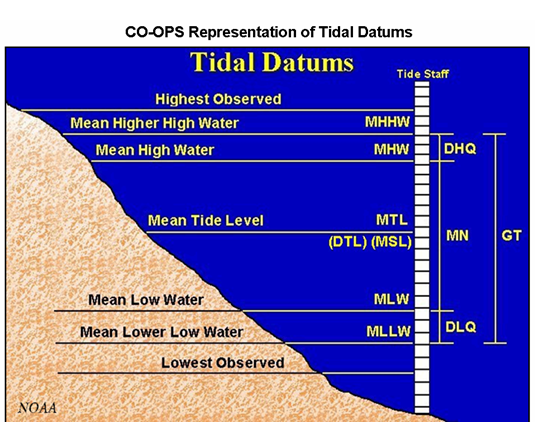
MHHW - Mean Higher High Water: The average of the higher high water
height of each tidal day observed over the National Tidal Datum Epoch. For stations with shorter
series, comparison of simultaneous observations with a control tide station is made in order to
derive the equivalent datum of the National Tidal Datum Epoch.
MHW - Mean High Water: The average of all the high water heights observed over the National
Tidal Datum Epoch. For stations with shorter series, comparison of simultaneous observations with a
control tide station is made in order to derive the equivalent datum of the National Tidal Datum Epoch.
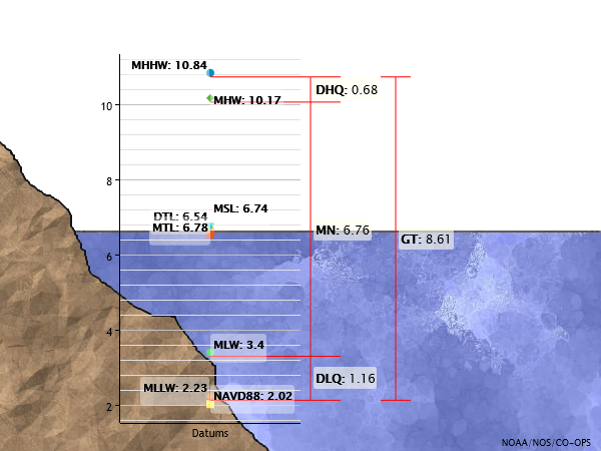
MSL - Mean Sea Level: The arithmetic mean of hourly heights observed over the National Tidal
Datum Epoch. Shorter series are specified in the name; e.g. monthly mean sea level and yearly mean
sea level.
NAVD - North American Vertical Datum of 1988 (NAVD88): A fixed reference for elevations
determined by geodetic leveling. The datum was derived from a general adjustment of the first-order
terrestrial leveling nets of the United States, Canada, and Mexico. In the adjustment, only the
height of the primary tidal bench mark, referenced to the International Great Lakes Datum of 1985
(IGLD 85) local mean sea level height value, at Father Point, Rimouski, Quebec, Canada was held
fixed, thus providing minimum constraint. NAVD 88 and IGLD 85 are identical. However, NAVD 88
bench mark values are given in Helmert orthometric height units while IGLD 85 values are in
dynamic heights. See International Great Lakes Datum of 1985, National Geodetic Vertical Datum
of 1929, and geopotential difference. NAVD 88 should not be used as Mean Sea Level.
MLW - Mean Low Water: The average of all the low water heights observed over the National
Tidal Datum Epoch. For stations with shorter series, comparison of simultaneous observations with
a control tide station is made in order to derive the equivalent datum of the National Tidal Datum Epoch.
MLLW - Mean Lower Low Water: The average of the lower low water height of each tidal day
observed over the National Tidal Datum Epoch. For stations with shorter series, comparison of simultaneous
observations with a control tide station is made in order to derive the equivalent datum of the National
Tidal Datum Epoch.
EWL - Extreme Water Levels: The extreme levels measured by the CO-OPS tide gauges during
storms are called storm tides, which are a combination of the astronomical tide, the storm surge,
and limited wave setup caused by breaking waves. They do not include wave runup, the movement of
water up a slope. Therefore, the 1% annual exceedance probability levels shown do not necessarily
correspond to the Base Flood Elevations (BFE) defined by the Federal Emergency Management Administration
(FEMA), which are the basis for the National Flood Insurance Program.
NOAA's EWLs: For this product, the monthly extreme levels adjusted for relative sea level
trend, producing an unbiased data set from which the annual highest and lowest water levels are
derived. A Generalized Extreme Value (GEV) analysis is applied to this data set to determine the
expected frequency of extreme tides rising above or falling below any given level. The results are
a set of annual exceedance probability levels relative to the tidal datums for each station.
USACE's EWLs: Produced as is the NOAA EWLs using the statistical Percentile function rather
than GEV.
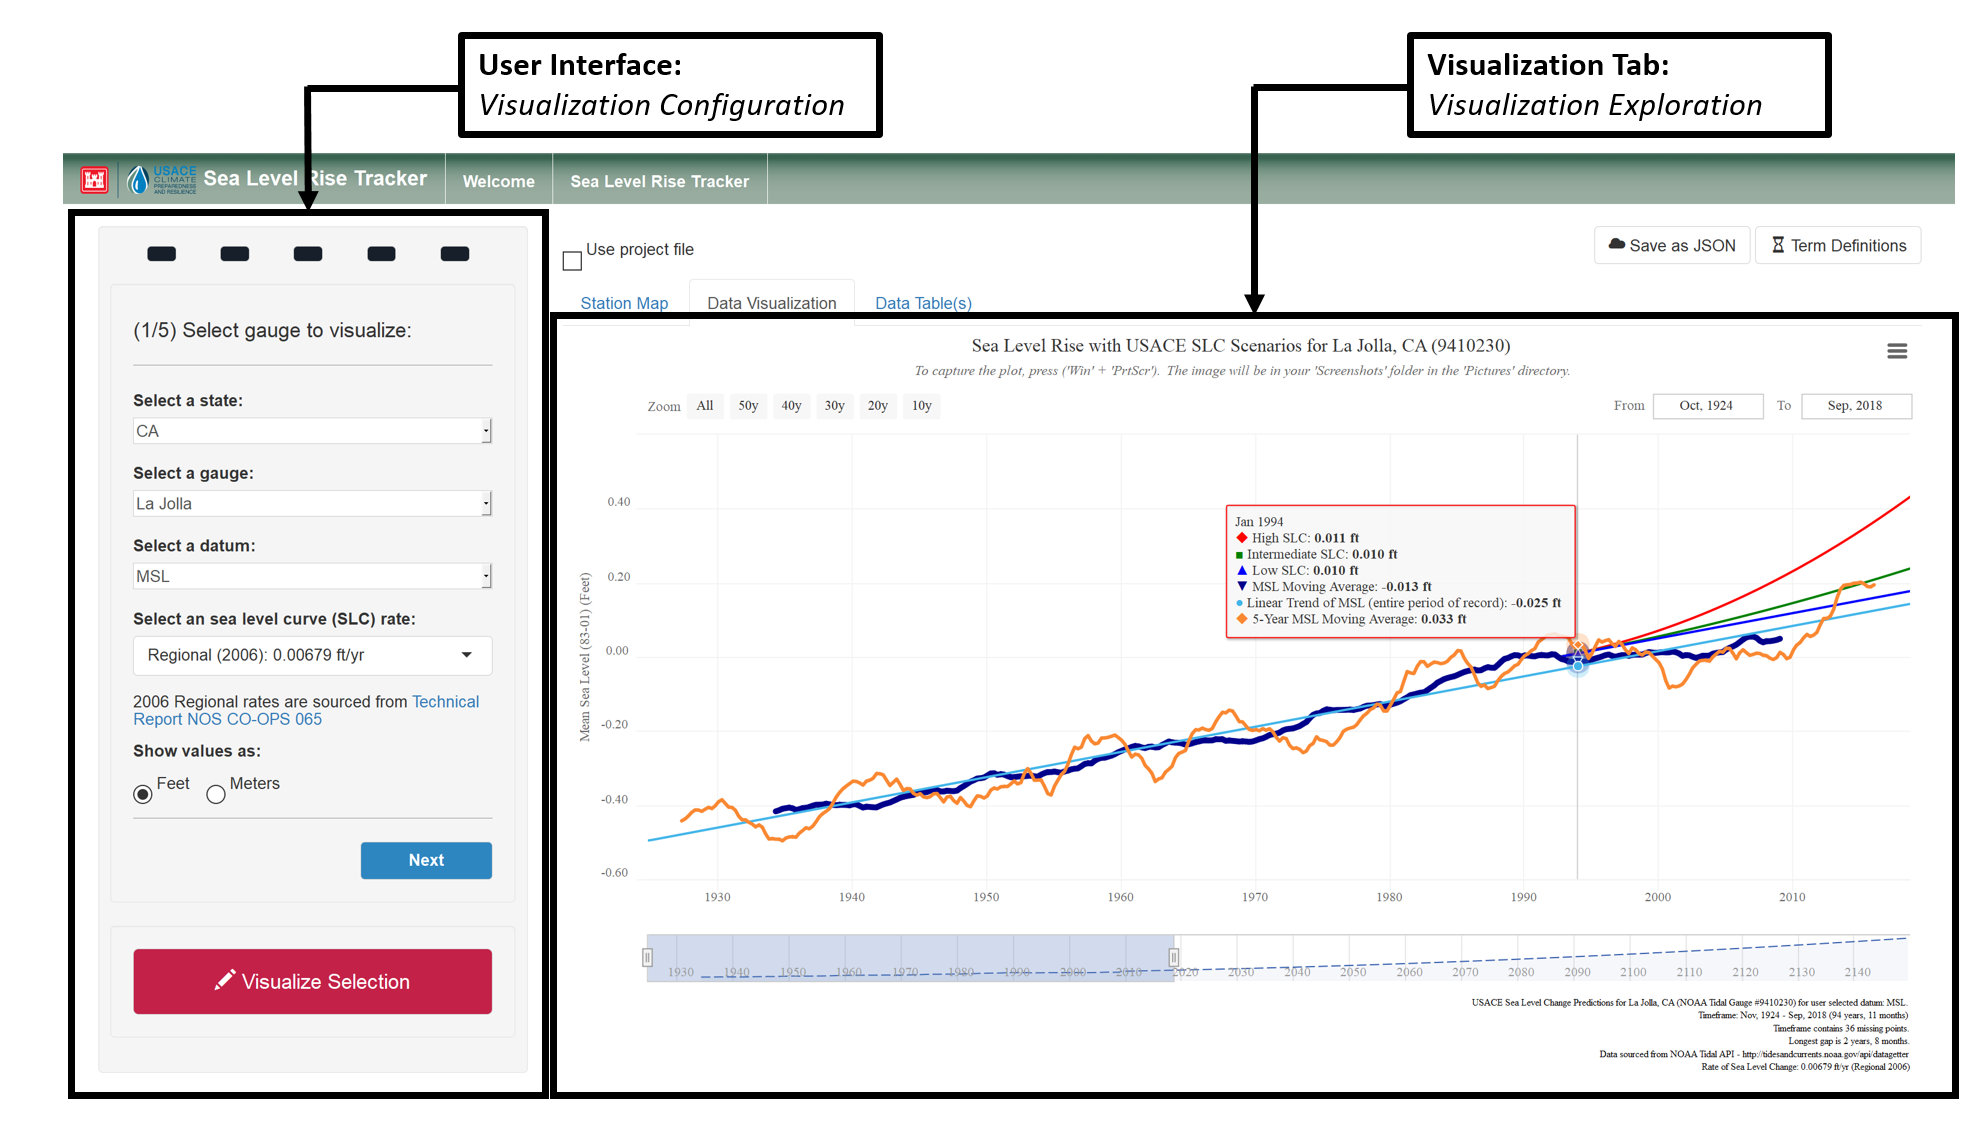
Linear Trend(s): The Sea Level Tracker fits a linear regression model for the monthly means
when requested by the user. The user has the choice to either fit a regression to the entire selected
period of record or a forty-year window. The values visible in the table and with the tooltips are the
value of the fit linear model for the selected date. The linear trend rates are visible via a module
that presents when the 'Trend Line Information' button below the plot is pressed.