

What's in the CHAT:
- Statistically-downscaled LOCA, CMIP-5 GCM model outputs included in the CHAT are analyzed annually for the period available for analysis (1951-2099). Model outputs included in the tool are also analyzed comparatively by describing monthly, simulated changes between different epochs (time periods).
- CHAT allows users to visualize annual streamflow, precipitation, and temperature time series model outputs and to perform simulated trend analysis for these annual time series. Annual model output is assessed for both a historic period (water years 1951-2005) and a future period (water years 2006-2099).
- Additionally, the tool provides a visualization of epoch-based differences in simulated, monthly and annual historic versus future period streamflow, precipitation and temperature model outputs.Epoch-based change in is analyzed by determining the mean of the monthly/annual value for the variable of interest for each GCM for three epochs: baseline (water years 1976-2005), mid-century (water years 2035-2064), and end-century (water years 2070-2099). The difference between computed means is determined for both the baseline vs. mid-century and baseline vs. end-century epochs.
- The CHAT includes robustness metrics which gives users insight into the inter-model robustness of the change projected for a selected variable. Robustness metrics provide an assessment of whether most GCMs agree on the direction of the future trend and whether most models agree that the future trend is significant relative to the historical variability.
Please cite the CHAT as follows: U.S. Army Corps of Engineers. (28 January 2023). Climate Hydrology Assessment Tool (CHAT). Version 2.3. https://climate.sec.usace.army.mil/chat (accessed MONTH YYYY).
Tool Updates, December 2022
What’s new in the Climate Hydrology Assessment Tool v2.3:
-
New streamflow, precipitation and temperature variables are now included in the tool (see list of new variables above).
-
Addition of new interface to select desired 8-digit HUC watershed and stream segment for subsequent tabs.
-
All variables have the ability to visualize projections driven by 1) individual Representative Concentration Pathways (RCPs) 4.5 or 8.5 or 2) an overlay of the projections produced using RCP 4.5 on RCP 8.5 together on the same plot.
-
Users are able to view robustness metrics for mid-century and end-century model outputs for each each RCP scenario on the Modeled Time Series Explorer tab.
-
Users can compare baseline (historic) to mid-century (projected) and baseline (historic) to end-century (projected) values on a monthly and annual basis for streamflow, precipitation and temperature variables
Tool Introduction & Motivation
USACE took the first step toward developing policy and guidance around projected changes to climate hydrology and how these changes might affect water resources project planning, design, construction, operation and maintenance by releasing Engineering and Construction Bulletin (ECB) 2014-10, Guidance for Incorporating Climate Change Impacts to Inland Hydrology in Civil Works Studies, Designs, and Projects. This was superseded by ECB 2016-25, and then by ECB 2018-14, the current guidance.
The analysis required by ECB 2018-14 includes consideration of both past (observed) simulated changes, as well as future (projected) simulated changes to relevant hydrologic and meteorologic (i.e. precipitation and temperature) variables. To support this requirement, a web-accessible tool was developed to allow USACE staff to easily access Global Climate Model (GCM) based, projected, climate influenced, hydroclimatology. The techniques required to obtain GCM based, climate influenced hydroclimate can be cumbersome and the multiple steps required could introduce errors that might undermine the interpretation of results. CHAT allows users to develop repeatable analytical results using consistent information. In doing so, we reduce the potential for errors and increase efficiency, so that information can be used earlier in the decision-making process.
CHAT is targeted at providing a means of visualizing modeled, climate influenced hydroclimate in comparison to modeled, historic (hindcast) period hydroclimate. CHAT also provides for a basic statistical analysis of the datasets presented in tool. CHAT output can be applied to characterize the directionality of climate change impacts when characterizing future without project conditions (FWOP). Additionally, the tool generates report quality graphics that can be used to communicate climate change impacts consistently.
- The Modeled Time Series Explorer tab provides a printable graphic displaying the range and mean of the modeled, historic and climate-changed conditions for the selected 8-digit HUC watershed and hydroclimate variable.
- The tool displays the range of modeled outputs produced using 32 GCMs for both the simulated historical and future timeframe.
- GCMs rely on scenarios representing different pathways to a given atmospheric concentration of greenhouse gas emissions (GHG) referred to as representative concentration pathways (RCPs). RCPs describe the simulated change in radiative forcing at the end of this century, as compared with pre-industrial conditions.
- Projected hydroclimate time series in CHAT are produced using two future scenarios: RCP 4.5 (where greenhouse gas emissions stabilize by the end of the century) and RCP 8.5 (where greenhouse gas emissions continue to increase throughout the century).
- For streamflow, precipitation and temperature variables, the future values can be viewed for each RCP scenario separately or together overlaid on the same plot.
- The Modeled Time series Trend Analysis tab provides a printable graphic of trendlines fit to the mean of the historical simulations and the mean of the projected future simulations of modeled hydroclimate variables included in the tool. Simulated trend line slope, as well as an evaluation of statistical significance is also provided within the Modeled Time series Trend Analysis Tab.
- The Monthly Box Plots: Epoch-Based Changes tab provides a printable graphic that compares differences in the mean of a monthly streamflow, precipitation or temperature variable between the 1950-2005 historic epoch versus the mean computed for two future epochs. The epoch-based mean is computed across the simulation generated for each epoch produced by the 32 GCMs (32 time series). Separate comparisons are plotted using RCP 4.5 versus RCP 8.5.
- The Annual Box Plots: Epoch-Based Changes tab provides a printable graphic that compares differences in the mean of a annual streamflow, precipitation or temperature variable between the 1950-2005 historic epoch versus the mean computed for two future epochs. The epoch-based mean is computed across the simulation generated for each epoch produced by the 32 GCMs (32 time series). Separate comparisons are plotted using RCP 4.5 versus RCP 8.5.
CHAT Variables Available for Analysis
-
Streamflow:
1. Annual-Maximum of Mean Monthly Streamflow
2. Annual-Mean 1-day Streamflow
3. Annual-Streamflow Volume
4. Change in Monthly Mean Streamflow
5. Change in Monthly Accumulated Streamflow
6. Change in Annual Mean Streamflow
7. Change in Annual-Streamflow Volume
8. Change in Annual-Maximum of Mean Monthly Streamflow -
Precipitation:
1. Annual-Maximum 3-day Precipitation
2. Annual-Maximum 1-day Precipitation
3. Drought Indicator: Annual-Maximum of Number of Consecutive Dry Days
4. Annual-Accumulated Precipitation
5. Change in Monthly Accumulated Precipitation
6. Change in Monthly-Maximum 1-day Accumulated Precipitation
7. Change in Monthly-Maximum 3-Day Accumulated Precipitation
8. Change in Annual-Maximum 3-day Precipitation
9. Change in Annual-Maximum 1-day Precipitation
10. Change in Drought Indicator
11. Change in Annual-Accumulated Precipitation -
Temperature:
1. Annual-Mean 1-day Temperature
2. Annual-Maximum 1-day Temperature
3. Annual-Minimum 1-day Temperature
4. Change in Monthly-Maximum Temperature
5. Change in Monthly-Mean Temperature
6. Change in Monthly-Minimum Temperature
7. Change in Annual-Mean 1-day Temperature
8. Change in Annual-Maximum 1-day Temperature
9. Change in Annual-Minimum 1-day Temperature
Model Output Methodology
A summary of model outputs used to populate the tool is listed below. For more information, please refer to the User Guide available in the Help tab.
-
Model outputs displayed in the tool is derived based on Coupled Model Intercomparison Project Phase 5 (CMIP-5) Global Climate Model (GCM) meteorological model outputs. GCM products are statistically downscaled using the Localized Constructed Analogs (LOCA) method.
-
Future, climate-changed hydroclimate is derived using Representative Concentration Pathways (RCPs) 4.5 and 8.5.
-
Streamflow model outputs: LOCA-downscaled meteorological outputs, derived from the GCMs, are translated into a hydrologic response using a Variable Infiltration Capacity (VIC) macroscale hydrology model. Areal runoff and baseflow from the VIC distributed hydrology model are routed to and through the river network using mizuRoute. Flows displayed by CHAT are representative of the total flow for a selected stream segment of the mizuRoute routing network. Outflow from a given 8-digit HUC can be visualized by displaying results for the stream segment which transects the selected 8-digit HUC’s downstream boundary.
-
Precipitation model outputs: LOCA-downscaled accumulated daily precipitation model output is spatially aggregated to a 8-digit HUC resolution and then temporally aggregated in various ways. See the User Guide found in the Help tab for details on the spatial and temporal aggregation processing steps.
-
Temperature model outputs: LOCA-downscaled daily temperature model output is spatially aggregated to a 8-digit HUC resolution and then temporally aggregated in various ways. See the User Guide found in the Help tab for details on the spatial and temporal aggregation processing steps.
-
The 8-digit HUC shapefile used in this version of CHAT is current as of March 2016. If the 8-digit HUC boundary most relevant to your analysis has changed since 2016, please e-mail cprsupport@usace.army.mil for support.
Please Note: Some 8-digit HUCs do not have model outputs and some 8-digit HUCs do not have corresponding 8-digit HUC boundries. If 8-digit HUC is not found, contact CPR support (cprsupport@usace.army.mil) for specific inquiries about shapefiles and model outputs used in CHAT.
How to Interact: (all selections can be made through the dropdowns or interacting with the map)- Select the 4-digit HUC code (HUC-4)
- Select the 8-digit HUC code (HUC-8)
- Select desired stream segment
- Click Submit Inputs under the map to update selections and generate plots in Modeled Time Series Explorer
1. Select 4-digit HUC
2. Select 8-digit HUC
3. Select Stream Segment
Please Note:
Click
Reload Plot
below each time after variable selections or the
RCP selection to refresh results.
Meteorological outputs are analyzed by 8-digit HUC. Segment based flow outputs
correspond to the stream segment drainage areas.
Click
Back to Study Location Selector
to select a new 8-digit HUC watershed or stream segment.
Click here to view more information about the robustness metrics
Robustness Metrics
For additional information on the robustness metric, please see section 2.2.4 of the CHAT User Guide .
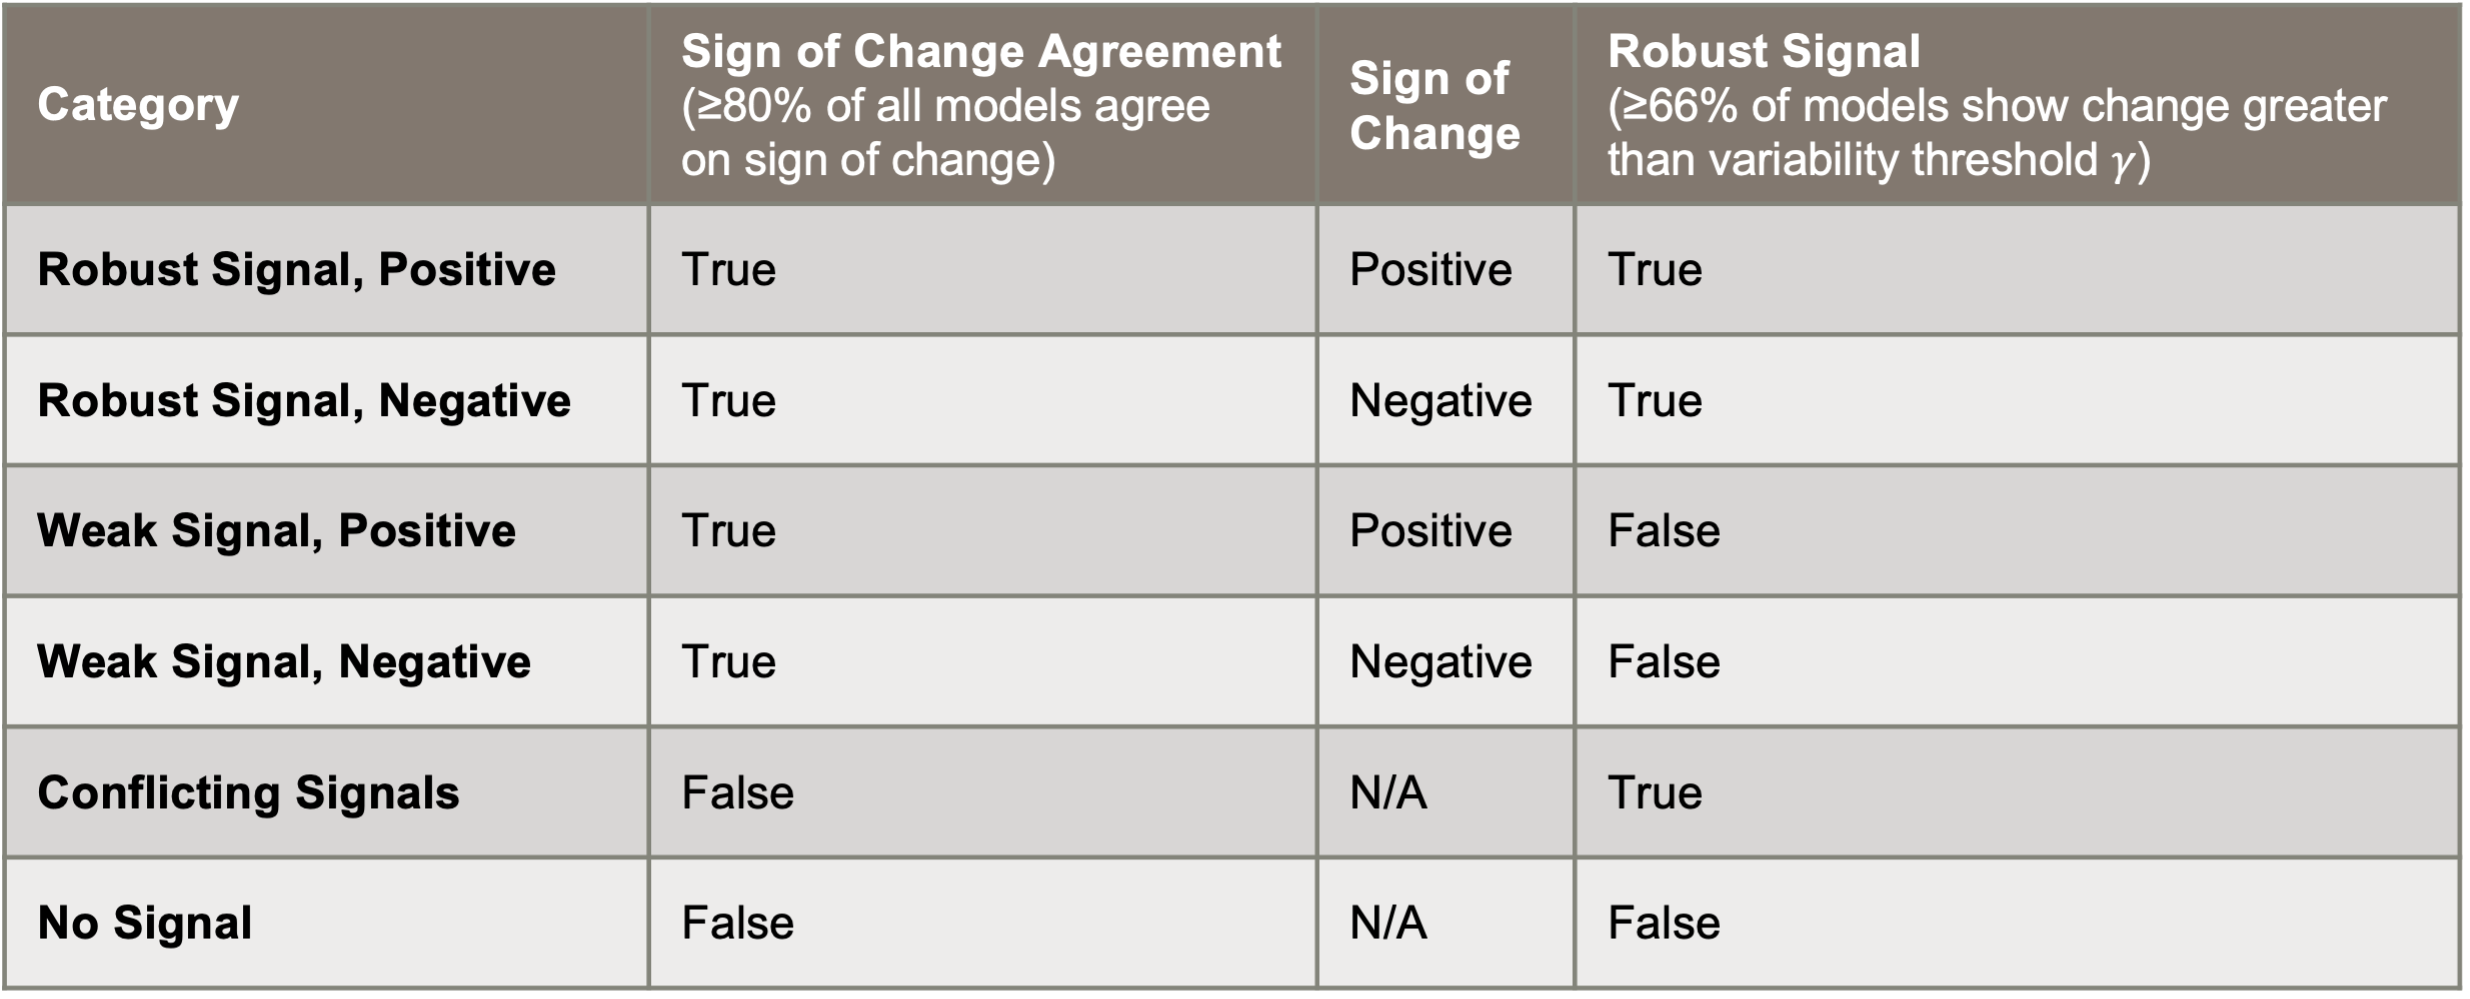

Robust Signal, Positive

Robust Signal, Negative

Conflicting Signals

Weak Signal, Positive

Weak Signal, Negative

No Signal
About the CMIP5 Modeled Output
Streamflow Variable:
Runoff is displayed in CHAT for the selected stream segment. Output displayed represents the cumulative runoff from all upstream segments, as well as local runoff contributions which reach the selected segment.
Temperature and Precipitation Variables:
The temperature and precipitation variables are derived from statistically-downscaled LOCA, CMIP-5 GCM meteorological outputs that have been spatially aggregated to a 8-digit HUC resolution. They represent the temperature and precipitation modeled within a specific 8-digit HUC’s boundaries.
Simulated Trend Lines
Statistical Significance Tests (Historical)
Statistical Significance Tests (Future)
Please Note:
Click
Reload Plot
below each time after variable selections or the RCP selection to refresh
results. Users can remove trendlines from the graph by clicking on the title
of the appropriate series in the legend. Once deselected, the associated
line will be removed from the plot and the legend entry will be greyed out.
To re-display click on the greyed out legend entry.
Meteorological
outputs are analyzed by 8-digit HUC. Segment based flow outputs
correspond to the stream segment drainage areas.
Click
Back to Study Location Selector
to select a new 8-digit HUC watershed or stream segment.
About the CMIP5 Modeled Output
p-value Guidance
The p-values displayed below are reflective of the linear regression fit drawn above. A smaller p-value indicates greater statistical significance. The typically adopted threshold for statistical significance prescribed by the majority of statistical references is 0.05 is associated with a 5% risk of a Type I error or false positive. This is the threshold of significance applied by the CHAT.
** Indicates a statistically significant simulated trend (at the alpha = .05 level) was detected.
Please Note:
Click
Reload Plot
below each time after variable selections to refresh results.
Meteorological outputs are analyzed by 8-digit HUC. Segment based flow outputs
correspond to the stream segment drainage areas.
Click
Back to Study Location Selector
to select a new 8-digit HUC watershed or stream segment.
About the CMIP5 Modeled Output
Documents
USER GUIDEIf you have any questions or comments, please let us know by contacting our team: cprsupport@usace.army.mil